
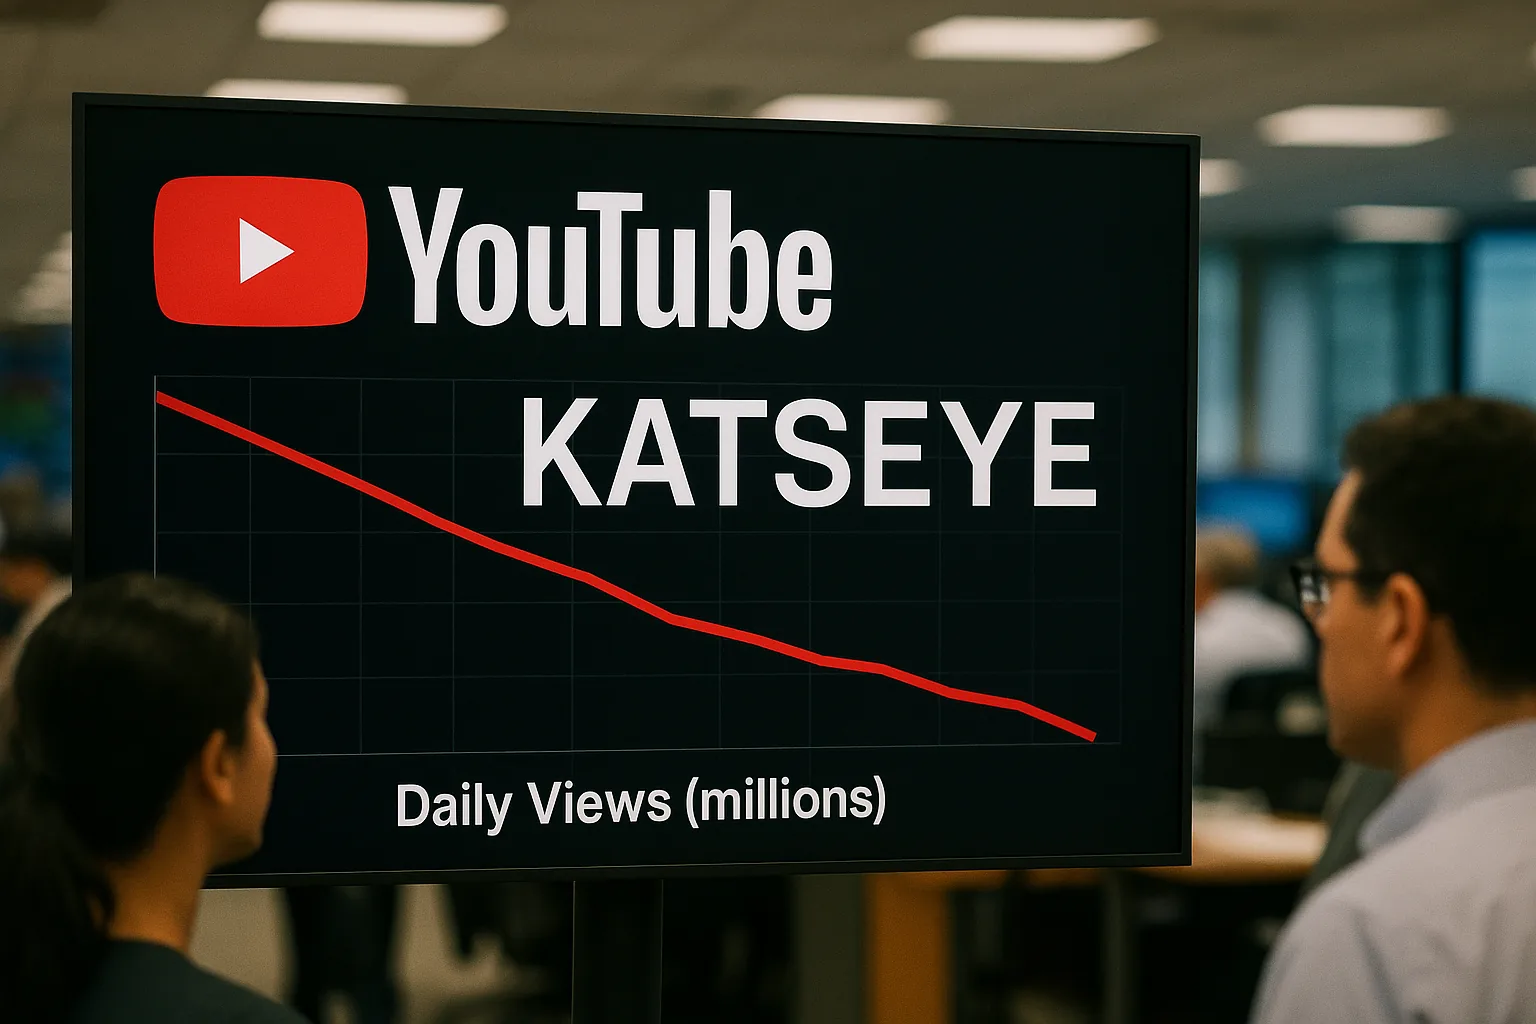
The release of official YouTube viewership data for the week of October 5-11, 2026, prompted a sharp downward revision in prediction markets for K-pop group KATSEYE's peak daily performance. Contracts on the Kalshi exchange tracking whether the group’s highest daily view count would surpass 20 million fell precipitously from 74% to 10% in Monday's session (October 12, 2026). The repricing reflects traders aligning expectations with newly available data showing a weekly peak significantly lower than in previous periods.
The market adjustment was not a uniform decline but rather a convergence toward a new, lower consensus range. As odds for exceeding 20 million views collapsed, the probability of surpassing 19 million surged from 70% to 99%. This indicates traders are now highly confident the week's peak viewership landed in the narrow window between 19 million and 20 million, a significant shift from previous expectations that placed the peak comfortably above the 20 million threshold.
Distribution Analysis
The following table details the probability shifts across all related contracts, which are structured as a series of independent "Yes/No" questions on different thresholds. The majority of contracts tracking higher view counts saw their probabilities decline on significant trading volume.
| Outcome | Current Prob | Change | Volume |
|---|---|---|---|
| Above 18M | 99% | +1.0pp | 1,967 |
| Above 19M | 99% | +29.0pp | 2,508 |
| Above 21M | 18% | -37.0pp | 3,851 |
| Above 20M | 10% | -64.0pp | 1,849 |
| Above 25M | 5% | +3.0pp | 1,782 |
| Above 22M | 1% | -10.0pp | 3,709 |
| Above 23M | 1% | -12.0pp | 3,985 |
| Above 24M | 1% | ~0pp | 2,952 |
Net: Four of the eight contracts declined on a combined volume of over 13,000, shifting the implied consensus for the peak daily view count to a range below 20 million.
What's Driving the Shift
The significant repricing appears driven by traders reacting to concrete performance data that contradicted earlier, more optimistic forecasts.
Hard Data Contradicts Estimates: The primary catalyst is the release of official data for the market's settlement period. According to analytics platform OddsAssist, which tracks data from the settlement source, KATSEYE's maximum daily views for the week of October 5 reached only 15.7 million through Thursday. This figure is substantially below the 20 million mark and provides a strong factual anchor for the market's downward revision.
Declining Weekly Trend: The newly released data confirmed a broader cooling trend. Viewership for Monday through Thursday of the settlement week was down 11-14% compared to the three-week average for the same days. This fundamental decline in performance undercut the case for achieving a new peak, which in prior weeks had surpassed 23 million views.
Convergence on a New Range: The market's movement shows a classic pattern of convergence as uncertainty is resolved. The simultaneous collapse of the "Above 20M" contract and the surge in the "Above 19M" contract suggests traders are no longer speculating on a wide range of outcomes. Instead, they are using the partial-week data to pinpoint a final figure, which is now heavily implied to be between 19 and 20 million.
Market Context
Prior to the release of the October 5-11 data, market expectations were buoyed by KATSEYE's strong performance in September. The group's highest daily view count had exceeded 22.8 million in the week of September 28 and 23.9 million the week prior. This established a precedent for clearing the 20 million threshold, supporting the initially high 74% odds.
However, a look at individual music videos like "Animal" and "Hootie Frutti" shows that while they still contribute millions of daily views, their totals have been gradually declining since their release peaks in July and August. The absence of a new major release in the settlement week meant the group's total daily viewership was more susceptible to this natural decay, a factor the market has now priced in.
What to Watch
The market is scheduled to close on October 13, 2026, with settlement based on the highest daily global view count for KATSEYE's official artist channel as reported by YouTube Charts. While the data through Thursday provides a strong signal, the final, official figures for Friday, Saturday, and Sunday will determine the outcome. Any unexpected revisions or a weekend surge beyond the established trend are the only remaining variables that could alter the now-expected outcome.
