
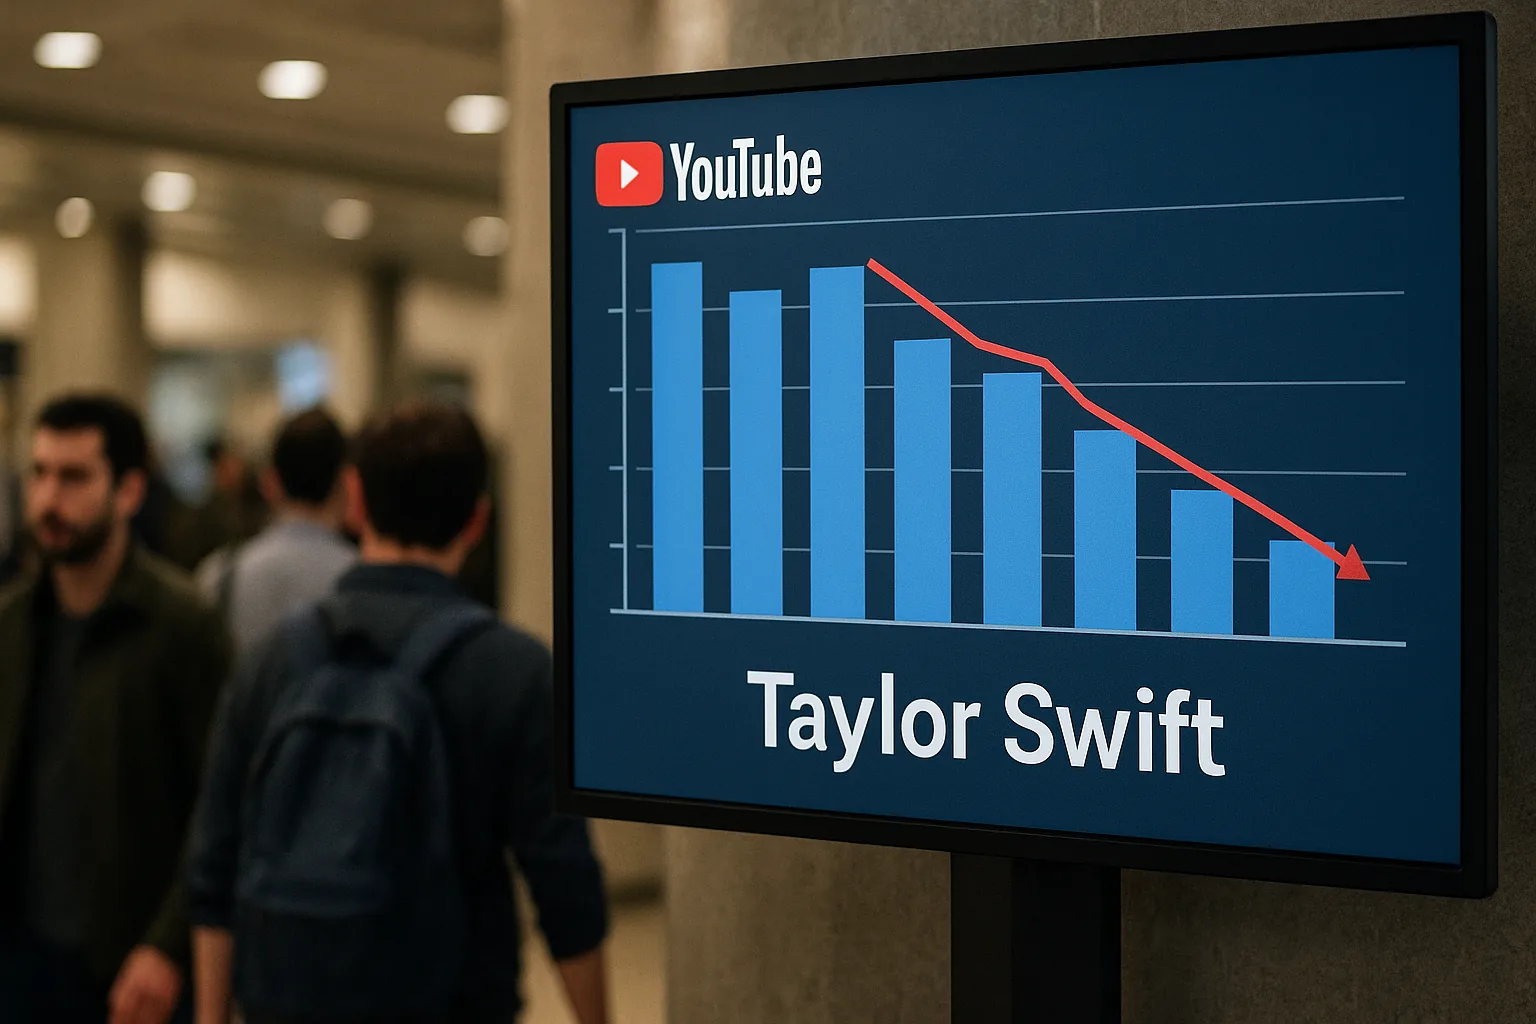
Lower-than-expected daily YouTube viewership figures for Taylor Swift during the week of September 14-20, 2026, prompted a sharp sell-off in related prediction markets. Contracts on the Kalshi exchange betting on the artist's peak daily views exceeding 14.9 million for the week plummeted from a 70% implied probability to just 2% in the session ending September 20, 2026. The widespread repricing across all high-end outcomes suggests traders are aligning their positions with performance data that fell short of earlier, more bullish expectations.
The market-wide decline indicates a firm consensus that Swift's peak viewership for the week did not reach the 15 million threshold that traders had previously priced as a likely event. This move reflects a shift from speculative bets on a potential viral spike to a reality-based pricing model as the week's performance data became fully available.
Distribution Analysis
The repricing was not isolated to a single outcome but represented a systemic downward revision of expectations. All 11 of the highest-threshold contracts for the week saw their probabilities collapse, with many falling by more than 40 percentage points on significant trading volume.
| Outcome | Current Prob | Change (24h) | Volume (24h) |
|---|---|---|---|
| Above 15M | 5% | -65.0pp | 260 |
| Above 14.9M | 2% | -68.0pp | 457 |
| Above 15.2M | 2% | -43.0pp | 755 |
| Above 15.4M | 2% | -36.0pp | 435 |
| Above 15.8M | 2% | -6.0pp | 32 |
| Above 15.1M | 1% | -49.0pp | 668 |
| Above 15.3M | 1% | -18.0pp | 538 |
| Above 15.5M | 1% | -26.0pp | 767 |
| Above 15.6M | 1% | -13.0pp | 609 |
| Above 15.7M | 1% | -18.0pp | 825 |
| Above 15.9M | 1% | -4.0pp | 745 |
Net: All 11 of the listed high-end contracts declined on a total volume of 6,090 trades, signaling a definitive market consensus that peak viewership for the week would fall below 14.9 million views.
What's Driving the Shift
The market recalibration appears to be a direct response to concrete viewership data from the September 14-20 period, which contrasted sharply with historical highs and speculative hopes.
Underwhelming Performance Data: The primary driver for the sell-off was the artist's actual daily YouTube view count during the market's reference week. Analysis based on data through September 12 and historical trends indicated a consistent daily average of approximately 5.2 million views, a figure substantially below the thresholds traders had been pricing. This follows a similar pattern from the prior week, where a reported daily average of 10.92 million also caused a downward revision of peak expectations.
Competitive Landscape: The repricing occurred in a context where competing artists are posting significantly higher numbers. A related Kalshi market for Bad Bunny's highest daily view count in September implies a 99% probability of exceeding 26.5 million views. This sets a high bar for top-tier performance and provides a benchmark against which Swift's weekly numbers appeared modest, likely influencing trader sentiment.
Shift from Speculation to Reality: Earlier in the month, high market probabilities were partially sustained by speculation around a potential new music announcement. An analysis from September 4 noted that the expectation for a surprise release was a key factor behind the market pricing in a high likelihood of surpassing 14.9 million views. As the week progressed without such a catalyst, the market's focus shifted to the observable, and lower, daily performance metrics.
Market Context
This sharp downward adjustment for the week of September 14-20 reflects a market that is highly responsive to real-time data. While Swift’s YouTube channel maintains a massive subscriber base and overall viewership, ranking 60th globally for subscribers, this specific market focused on a short-term peak that did not materialize.
The outcome contrasts with longer-term markets, such as one for Swift's peak views across the entire month of September, which had previously assigned a 99% probability to her exceeding 14.9 million views at some point during the month. The collapse in the weekly market suggests that while a monthly peak might still have been considered possible earlier, the opportunity for such a spike during this particular week had definitively passed in the eyes of traders.
What to Watch
This market, titled "Taylor Swift: Highest daily view count (September 14, 2026 - September 20, 2026)," is scheduled to close at 10:00 a.m. EDT on September 22, 2026.
The final outcome will be determined by the highest single-day global view count for Taylor Swift during the specified week, as officially reported by YouTube Charts. Given the market's decisive move, traders will be watching the final settlement to confirm the widely anticipated "No" resolution for these high-threshold contracts.
