
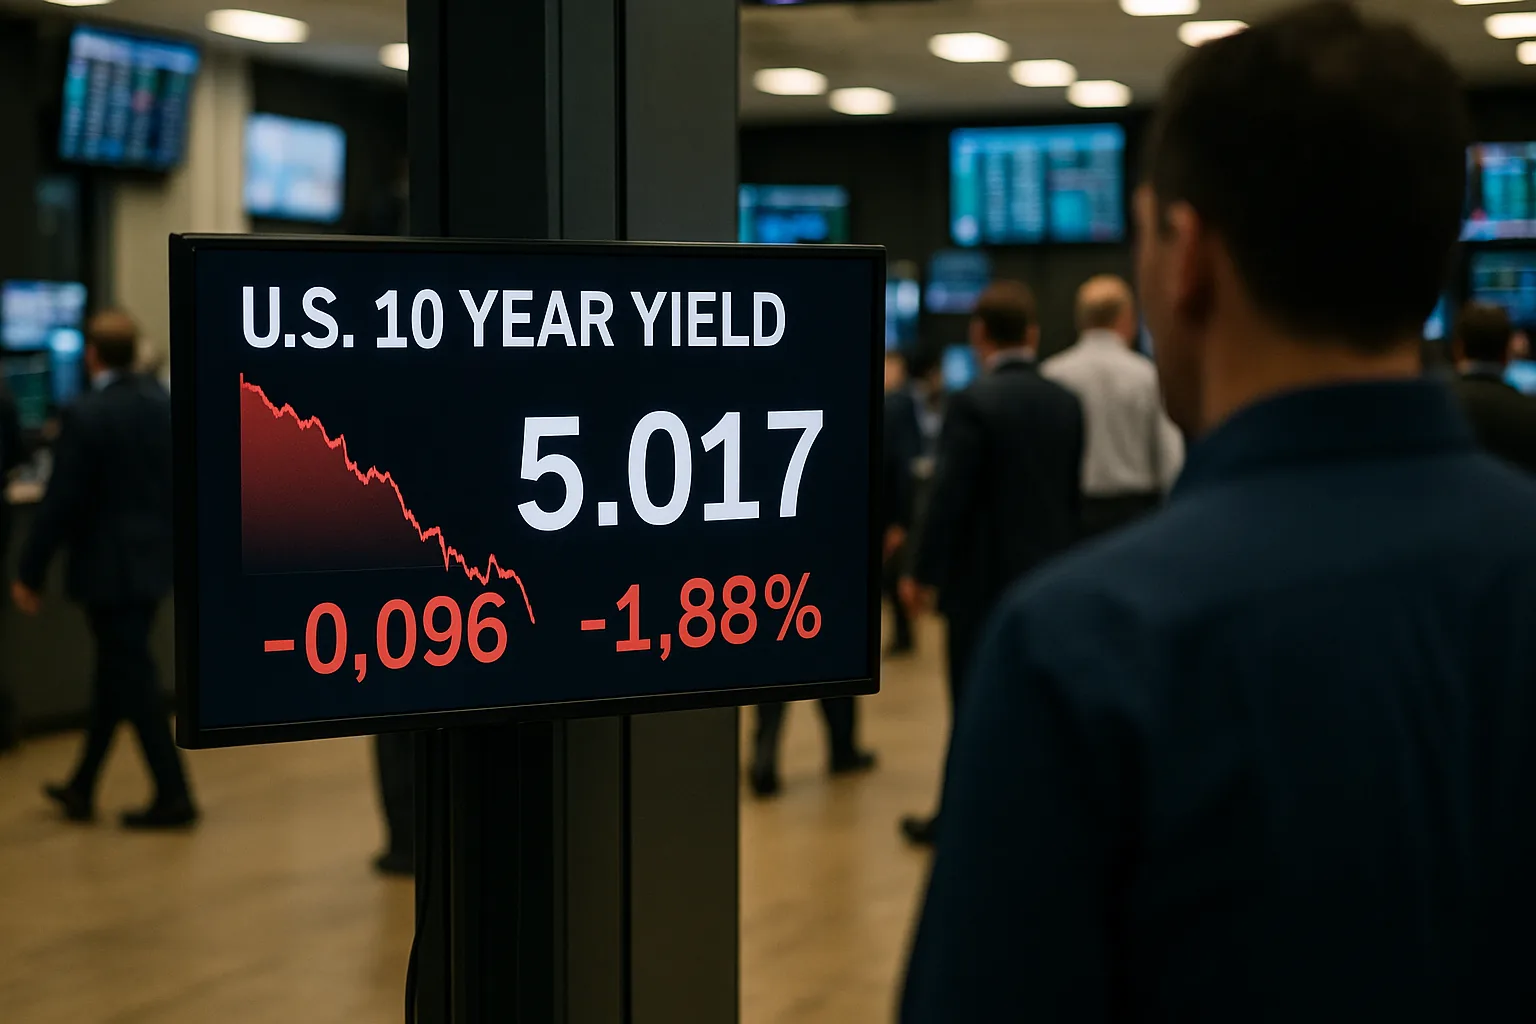
A sharp drop in the benchmark 10-year U.S. Treasury yield on Thursday, October 15, 2026, dramatically reshaped expectations in financial prediction markets, sending the implied probability of the monthly low falling below 5.08% soaring. The move followed the release of hotter-than-expected producer price inflation data, which paradoxically triggered a bond rally. On the Kalshi exchange, contracts for the 10-year yield reaching a low of "5.08% or below" by October 30 jumped to 89% probability, a 74-percentage-point rise, as the underlying bond yield itself fell toward that level.
The broad-based repricing saw every contract tracking lower potential yields gain probability, reflecting a strong consensus that the recent peak in rates may be giving way to a new, lower range. The actual 10-year yield fell by more than 12 basis points during the session to settle around 5.06%, directly aligning with the levels that traders now see as highly probable for the month’s low point.
Distribution Analysis
The shift in probability was unanimous across all listed outcomes, with traders rapidly pricing in a higher likelihood of the October low being established in the 5.00%-5.08% range. Contracts saw significant gains, particularly at thresholds the spot yield approached or crossed on Thursday.
| Outcome | Current Prob | Change | Volume |
|---|---|---|---|
| 5.08% or below | 89% | +74.0pp | 431 |
| 5.06% or below | 89% | +78.0pp | 11 |
| 5.09% or below | 84% | +62.0pp | 62 |
| 5.05% or below | 80% | +64.0pp | 11 |
| 5.04% or below | 76% | +32.0pp | 23 |
| 5.03% or below | 73% | +28.0pp | 1 |
| 5.07% or below | 71% | +47.0pp | 218 |
| 5.01% or below | 47% | +20.0pp | 101 |
| 5% or below | 43% | +7.0pp | 60 |
Net: 9 of 9 contracts rose on 918 total volume, shifting the implied consensus decisively toward a lower monthly trough for the 10-year Treasury yield.
What's Driving the Shift
Spot Yield Plunge: The primary driver was the significant real-time drop in the benchmark 10-year Treasury yield. The yield, which was as high as 5.28% on October 9, fell sharply to around 5.07% on October 15. The prediction market repricing is a direct reflection of the underlying asset's move, as the probability of the monthly low falling below a certain threshold increases dramatically once the current yield is already there.
Paradoxical Inflation Reaction: The move coincided with a week of strong inflation data. Following a hot Consumer Price Index (CPI) report on Wednesday, Thursday’s Producer Price Index (PPI) showed wholesale prices jumped 6.3% annually in September, well above expectations. Typically, high inflation puts upward pressure on yields. However, analysts suggest the market may have seen a flight-to-safety trade amid falling equities or felt that the recent run-up in yields was overdone, prompting a technical reversal.
Fed Policy Outlook: Despite persistent inflation, the market appears confident the Federal Reserve is near the end of its tightening cycle. Following Fed Chairman Kevin Warsh’s non-committal comments on future rate hikes, traders were pricing in an 87% chance the Fed will hold rates at its next meeting, according to the CME FedWatch Tool. This suggests investors believe the current policy rate is restrictive enough, allowing bonds to rally even on hot inflation news.
Market Context
The sudden drop in yields aligns with a long-held, though frequently challenged, view among many strategists that yields would fall from their multi-decade peaks. A recent Reuters poll of fixed-income strategists showed a median forecast for the 10-year yield to ease to 5.00% by year-end.
However, conviction for a sustained move lower is not universal. Some analysts argue that persistent inflation and large fiscal deficits will keep yields elevated. An October survey of economists by The Wall Street Journal projected the 10-year yield would end 2026 at 5.1%. Analysts at ING stated they would be "quite surprised if we were to break below 5% on the 10-year yield," anticipating a move back toward the 5.25% to 5.5% range. This week’s rally challenges that near-term outlook, bringing yields closer to the levels many had forecast for months away.
What to Watch
The key determinant for this market is the daily yield data published by the U.S. Department of the Treasury. The contract settles based on the lowest "Daily Treasury Real Yield Curve Rates" value for the 10-year constant maturity note from October 1 through October 30, 2026. With the spot yield already near 5.06%, the market will now watch to see if this level represents a new floor or if further downward momentum can be sustained ahead of the Federal Reserve's next interest rate decision in two weeks.
