
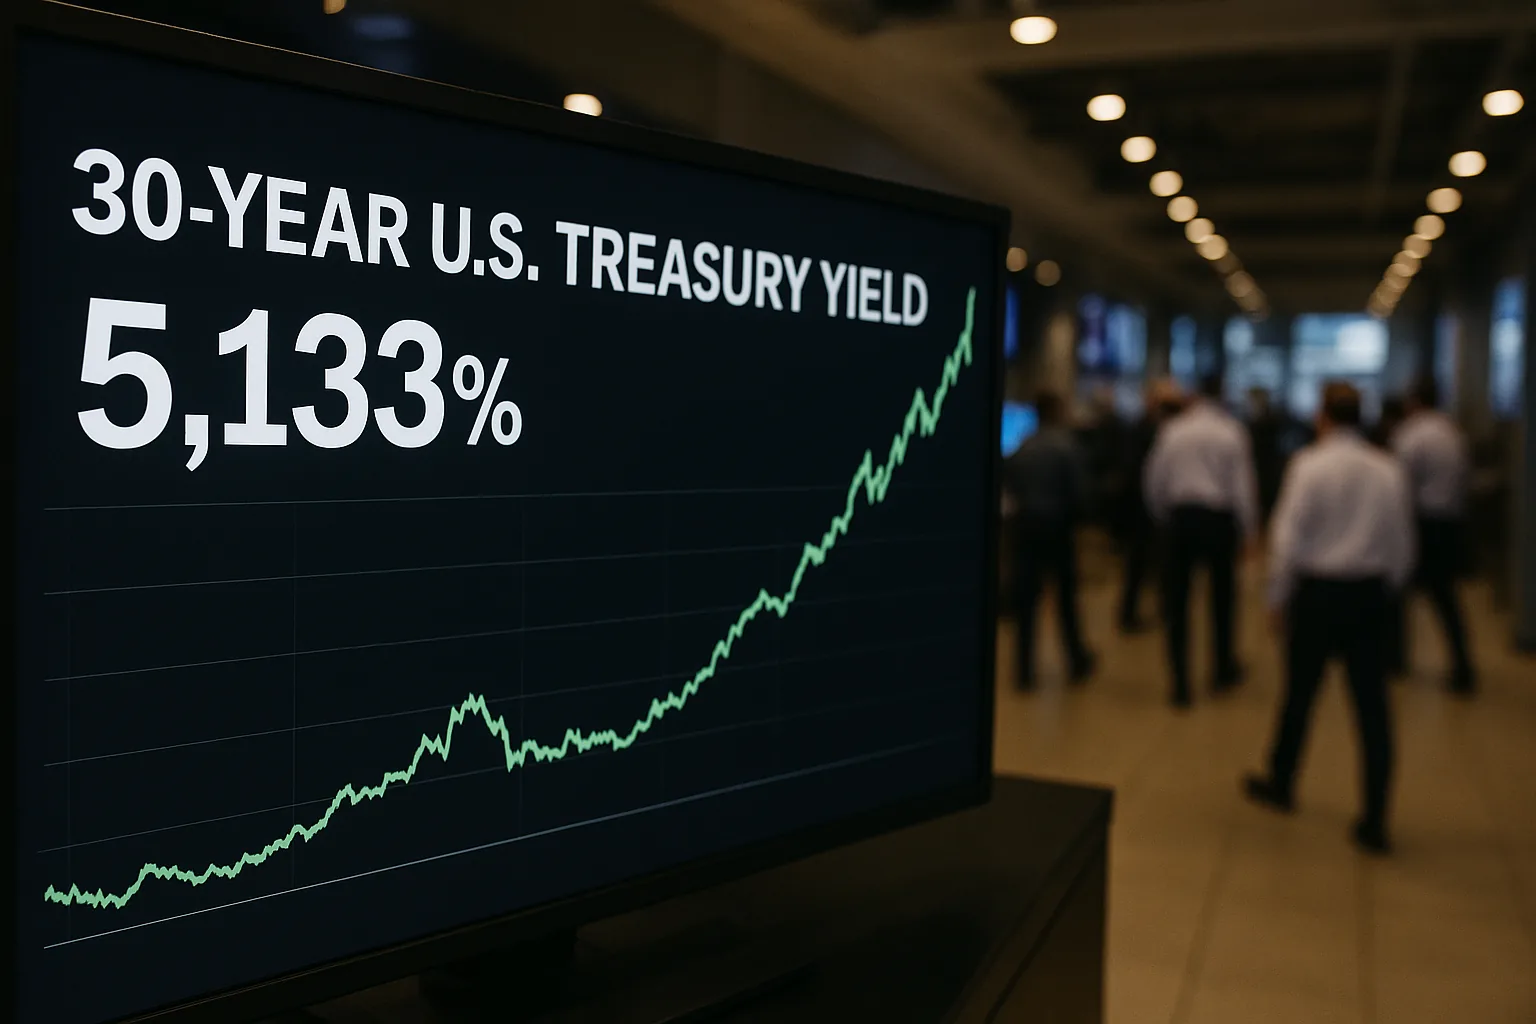
The 30-year U.S. Treasury yield surged to its highest level since 2002 in the session ending October 7, 2026, prompting a sharp sell-off in prediction markets pricing the odds of a near-term interest rate decline. On the Kalshi exchange, contracts betting the long-bond yield would dip below various thresholds this month saw their probabilities collapse, with the "5.53% or below" contract plummeting 69 percentage points to just 6%. The broad-based repricing reflects a strong consensus among traders that persistent inflationary pressures and heavy government debt issuance will keep long-term borrowing costs elevated, erasing hopes for a bond market rally before the month's end.
The market rout was directly correlated with moves in the underlying bond market. The U.S. Treasury reported the daily 30-year yield at 5.67% on October 7, up from 5.64% the prior day and continuing a steady climb that has defined the recent quarter. As the actual yield moves further above the strike prices in the prediction market, the likelihood of it reversing course to fall below those levels within the contract's short timeframe diminishes significantly.
Distribution Analysis
The probability decline was not isolated to a single outcome but was evident across the entire spectrum of this "how low" market, where traders bet on whether the yield will fall below specific levels by October 30. Of the 21 listed contracts, 19 saw their probabilities fall, many by double digits, while none registered gains.
| Outcome | Current Prob | Change | Volume |
|---|---|---|---|
| 5.59% or below | 55% | -9.0pp | 369 |
| 5.6% or below | 53% | -7.0pp | 274 |
| 5.58% or below | 49% | -28.0pp | 115 |
| 5.54% or below | 48% | -36.0pp | 442 |
| 5.57% or below | 40% | -20.0pp | 611 |
| 5.51% or below | 34% | -39.0pp | 629 |
| 5.5% or below | 31% | -46.0pp | 155 |
| 5.45% or below | 30% | -44.0pp | 179 |
| 5.56% or below | 25% | -41.0pp | 26 |
| 5.43% or below | 18% | -24.0pp | 24 |
| 5.34% or below | 17% | ~0pp | 227 |
| 5.36% or below | 13% | -7.0pp | 2 |
| 5.49% or below | 10% | -46.0pp | 257 |
| 5.46% or below | 9% | -37.0pp | 100 |
| 5.4% or below | 7% | -11.0pp | 28 |
| 5.53% or below | 6% | -69.0pp | 187 |
| 5.52% or below | 6% | -30.0pp | 75 |
| 5.42% or below | 5% | -12.0pp | 2 |
| 5.41% or below | 5% | -10.0pp | 5 |
| 5.37% or below | 5% | -15.0pp | 6 |
| 5.38% or below | 4% | ~0pp | 4 |
Net: 19 of 21 contracts declined on over 3,400 in total volume, signaling a broad-based repricing against the likelihood of a near-term yield decline.
What's Driving the Shift
The sell-off in the prediction market appears directly tied to fundamental pressures in the U.S. Treasury market, where a confluence of factors is pushing long-term yields higher.
Yields Hit Multi-Decade Highs: The most immediate driver is the spot 30-year yield itself, which now sits comfortably above every threshold offered in the prediction market. The climb to 5.67% continues a powerful uptrend, with some analysts forecasting further increases. Barclays has argued a path to 6% is possible if AI-driven investment boosts long-term productivity and growth, suggesting today's elevated rates could become a new baseline.
Cautious Institutional Demand: A key factor weighing on long-term bonds is a perceived lack of demand from large, price-insensitive buyers. In an analysis published October 6, Goldman Sachs noted that institutional investors like pensions and insurers are hesitant to buy long-duration bonds, seeing "no clear catalyst" for a rally. This sentiment suggests yields may need to remain high or climb further to attract significant capital.
Looming Supply and Fed Policy: The market is bracing for continued heavy debt issuance from the Treasury, with a key auction of 30-year bonds scheduled for this week. At the same time, Federal Reserve officials have indicated they expect to raise short-term interest rates again before year-end to combat inflation, reducing the appeal of locking in current long-term yields.
Market Context
The repricing on Kalshi aligns with a broader shift in expectations among Wall Street analysts, many of whom have been revising their yield forecasts upward. In early August, JPMorgan raised its year-end forecast for the 30-year yield to 5.40%, a level the market has already surpassed. The speed of the recent move has been particularly notable, reflecting a rapid reassessment of foundational assumptions about long-term growth, inflation, and monetary policy.
The current 30-year yield is now in a range not seen since before the 2008 financial crisis. According to analysis from Standard Chartered, the next technical resistance levels are the 2002 high of 5.47% and the 2001 high of 5.53%, both of which have now been breached, opening the door for a potential test of higher levels.
What to Watch
The most immediate event for bond traders is the Treasury's $22 billion auction of 30-year bonds scheduled for Thursday, October 8. The strength of demand at that auction will provide a critical barometer of investor appetite for long-duration U.S. debt at these elevated yields. Looking further ahead, upcoming inflation and employment data will be paramount in shaping the Federal Reserve's next policy decision. This prediction market is set to resolve based on whether the 30-year yield dips below the specified levels on any business day through October 30, 2026, according to daily data published by the U.S. Department of the Treasury.
