
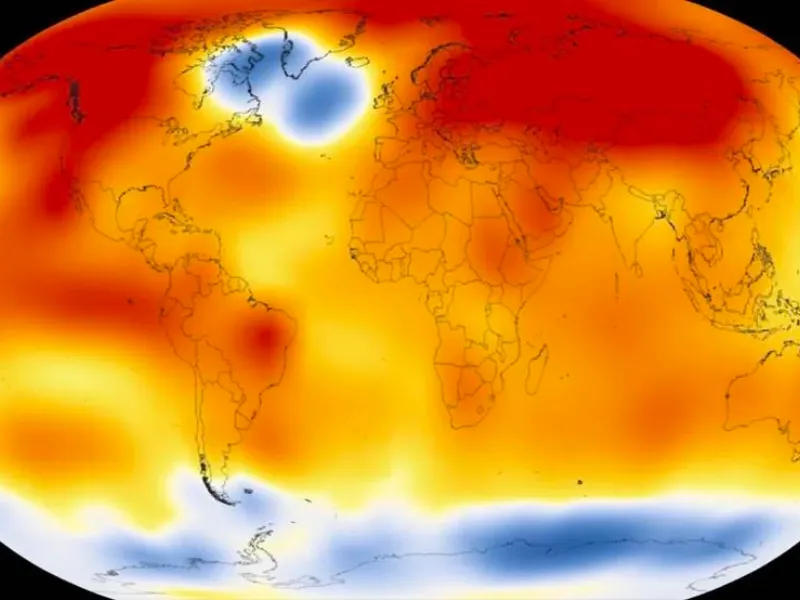
Apr 2026 temperature increase?
Short Answer
1. Market Behavior & Drivers
- No specific El Niño/La Niña forecasts are available for late 2025-early 2026.
- No major volcanic eruptions post-mid-2024 are impacting global temperatures.
- Solar Cycle 25 exceeded predictions, showing higher sunspot numbers than expected.
- NOAA GlobalTemp 6.1 introduces key methodological revisions for 2025-2026 data.
- April 2026 temperature anomaly calculation period is April 2025 through March 2026.
2. Price Chart
Historical Price (Probability)
3. Significant Price Movements
Notable price changes detected in the chart, along with research into what caused each movement.
Outcome: 1.10 to 1.16
📉 April 29, 2026: 10.0pp drop
Price decreased from 29.0% to 19.0%
Outcome: 1.17 to 1.23
📉 April 27, 2026: 13.0pp drop
Price decreased from 65.0% to 52.0%
📈 April 26, 2026: 40.0pp spike
Price increased from 59.0% to 99.0%
📈 April 25, 2026: 11.0pp spike
Price increased from 49.0% to 60.0%
📈 April 16, 2026: 12.0pp spike
Price increased from 38.0% to 50.0%
4. Market Data
Contract Snapshot
The "April temperature increase?" contract resolves to YES if the Land Ocean-Temperature Index for April 2026 is between 1.17-1.23, verified by the National Oceanic and Atmospheric Administration (NOAA). If the index falls outside this range, the market resolves to NO, as the event is mutually exclusive. The market closes on May 15, 2026, with a projected payout on May 17, 2026, and trading is prohibited for those with material, non-public information or employment by source agencies.
Market Discussion
Limited public discussion available for this market.
5. Are Strong El Niño or La Niña Expected in Late 2025-Early 2026?
| Specific ONI Anomalies | Not explicitly provided for late 2025-early 2026 in research [1]. |
|---|---|
| Probabilistic ENSO Forecasts | Not explicitly provided for late 2025-early 2026 in research [1]. |
| Forecast Uncertainty | Increases beyond 6-9 months lead time [1]. |
6. Have Post-Mid-2024 Volcanic Eruptions Caused Global Cooling?
| Major Eruption Activity | No VEI 6+ eruption since mid-2024 [1] |
|---|---|
| Ruang Eruption VEI | 4 (April 2024) [2] |
| Background Stratospheric AOD | Approximately 0.005 [3] |
Sources (4)
- 1Global Volcanism Program | What was erupting in the year...?volcano.si.edu
- 2ACP - Global transport of stratospheric aerosol produced by Ruang eruption from EarthCARE ATLID, limb-viewing satellites and ground-based lidar observationsacp.copernicus.org
- 3EGUsphere - A global view of the stratospheric background, volcanic and wildfire aerosol in the CALIOP era (2006–2023)egusphere.copernicus.org
- 42024–2026 Kanlaon eruptionsen.wikipedia.org
7. How Did Solar Cycle 25 Exceed Predicted Activity Levels?
| Forecasted Sunspot Number Peak | 115 (July 2025) [1] |
|---|---|
| Observed Sunspot Number Peak | 169.9 (October 2024) [2] |
| Forecasted F10.7cm Flux Peak | 150 solar flux units (sfu) [1] |
Sources (4)
- 1Solar Cycle Progression | NOAA / NWS Space Weather Prediction Centerswpc.noaa.gov
- 2Solar Cycle 25 reached its maximum in October 2024 | SIDCsidc.be
- 3Solar Cycle Prediction at NOAA's Space Weather Prediction Centeragupubs.onlinelibrary.wiley.com
- 4Solar Cycle 25 Likely Reached the Highest Sunspot Number in over 20 Years | NOAA / NWS Space Weather Prediction Centerswpc.noaa.gov
8. What Recent Methodological Changes Impact Global Temperature Datasets?
| NOAA GlobalTemp V6.1 Update | Released December 2023, with AI-based gap-filling for polar regions [1] |
|---|---|
| NASA GISTEMP v4 Methodology | Unchanged, routine data updates, minor bug fixes [2] |
| HadCRUT5.1.0.0 Update | Released December 2021, minor adjustments to HadSST4 data [3] |
Sources (4)
- 1NOAAGlobalTemp Version 6: An AI-Based Global Surface Temperature Datasetrepository.library.noaa.gov
- 2Data.GISS: GISS Surface Temperature Analysis (GISTEMP) (v4) — Updates to Analysisdata.giss.nasa.gov
- 3Met Office Hadley Centre observations datasetsmetoffice.gov.uk
- 4SST Data: NOAA Extended Reconstruction SSTs Version 6 (ERSSTv6) | Climate Data Guideclimatedataguide.ucar.edu
9. What Is the Temperature Anomaly Calculation Period for April 2026?
| Calculation Period | April 2025 through March 2026 [1] |
|---|---|
| Designated Source Agency | NASA Goddard Institute for Space Studies (GISS) [2] |
| Data Release Lag | Approximately 2-3 weeks after month-end [3] |
11. Historical Resolutions
Historical Resolutions: 18 markets in this series
Outcomes: 3 resolved YES, 15 resolved NO
Recent resolutions:
- KXHMONTHRANGE-26MAR-T1.30: YES (Apr 15, 2026)
- KXHMONTHRANGE-26MAR-T1.03: NO (Apr 15, 2026)
- KXHMONTHRANGE-26MAR-B1.270: NO (Apr 15, 2026)
- KXHMONTHRANGE-26MAR-B1.200: NO (Apr 15, 2026)
- KXHMONTHRANGE-26MAR-B1.130: NO (Apr 15, 2026)
