
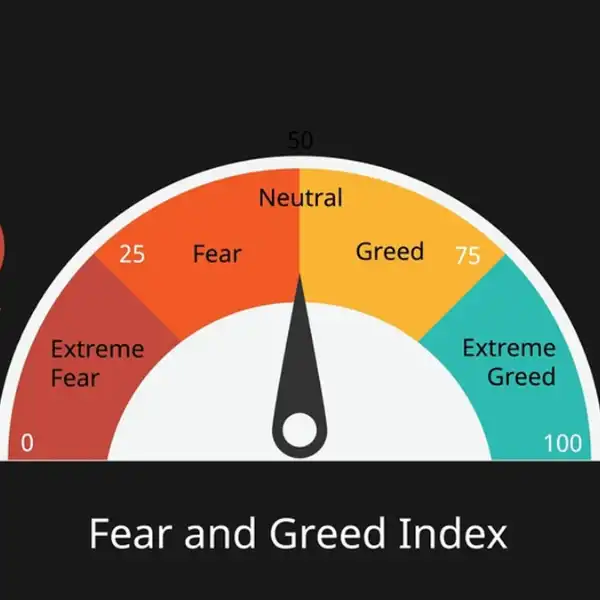
Fear & Greed Index on Sep 11, 2026?
Short Answer
1. Market Behavior & Drivers
- "Greed" is favored by market probability, reflecting corporate earnings resilience from AI.
- High "Fear" probability is driven by sticky inflation and reportedly increased rate hike expectations.
- Upcoming August CPI release and historical September volatility suggest overall market uncertainty.
Current Context
Sources (13)
- 1Fear & Greed Index on Friday? Odds & Predictions 2026 - Kalshikalshi.com
- 2Fear & Greed Index on Sep 11, 2026? — Kalshi Prediction Market Odds | CoinRithmcoinrithm.com
- 3Dow Jumps Around 300 Points Ahead Of Jobs Report: Investor Sentiment Improves, But Fear & Greed Index Rem - Benzingabenzinga.com
- 4https://www.sec.gov/Archives/edgar/data/2020932/000110465926093390/tm2622735d1_ex99-2.htmsec.gov
- 5https://www.sec.gov/Archives/edgar/data/1867102/000110465926098020/tm2623386d1_ex99-2.htmsec.gov
- 6https://www.sec.gov/Archives/edgar/data/1949257/000121390026088705/ea030190501ex99-1.htmsec.gov
- 7https://www.sec.gov/Archives/edgar/data/1941131/000114036126028882/ef20078194_ex99-1.htmsec.gov
- 8https://www.sec.gov/Archives/edgar/data/0000019617/000191870426026690/form424b2.htmsec.gov
- 9Global Markets’ Summer Lull to End as Volatility, Risks Mount - Bloombergbloomberg.com
- 10September 2026 Market Outlook | MRA Advisory Groupmraadvisory.com
- 11Weighing the markets – Counterpoint September 2026quintet.com
- 12Week of 8/31/2026: Equity Volatility Falls to Near a 1-Year Low Post Jackson Hole | Cboecboe.com
- 13Monthly house view | September 2026pictet.com
2. Price Chart
Historical Price (Probability)
3. Significant Price Movements
Notable price changes detected in the chart, along with research into what caused each movement.
Outcome: Greed
📈 September 08, 2026: 50.0pp spike
Price increased from 14.0% to 64.0%
📉 September 04, 2026: 23.0pp drop
Price decreased from 48.0% to 25.0%
📈 September 03, 2026: 27.0pp spike
Price increased from 21.0% to 48.0%
📉 September 01, 2026: 10.0pp drop
Price decreased from 36.0% to 26.0%
Outcome: Fear
📈 September 07, 2026: 8.0pp spike
Price increased from 42.0% to 50.0%
Sources (14)
- 1Asia stocks waver as yen surges, Iran warns of retaliation | Reutersreuters.com
- 2Week of 8/31/2026: Equity Volatility Falls to Near a 1-Year Low Post Jackson Hole | Cboecboe.com
- 3Index Insights: August 2026 | Cboecboe.com
- 4Week of 8/17/2026: Volatility/Convexity Premia Fall to Lowest YTD Levels on Benign Inflation Data | Cboecboe.com
- 5Fear & Greed Index on Friday? Odds & Predictions 2026 - Kalshikalshi.com
- 6Fear & Greed Index on Sep 11, 2026? — Kalshi Prediction Market Odds | CoinRithmcoinrithm.com
- 7S&P Global Investment Manager Index™ (IMI™)pmi.spglobal.com
- 8Prediction Market Odds Today: Fed, Bitcoin, Elections | Kresmionkresmion.com
- 9Crypto Fear & Greed Index hits 74 as Bitcoin breaks $82K, but did it mark a local top?bitcoinethereumnews.com
- 10Crypto Fear and Greed Index Falls to 69 Today, Signals Continued Greed | Gate Newsgate.com
- 11Dow Jumps Around 300 Points Ahead Of Jobs Report: Investor Sentiment Improves, But Fear & Greed Index Rem - Benzingabenzinga.com
- 12Crypto Fear and Greed Index Rises to 65 on September 3, Market Sentiment Remains in Greed Zone | Gate Newsgate.com
- 13Blowout U.S. Jobs Report & Gulf Conflict Rock Global Markets - Lemon Juice Labslemonjuicelabs.com
- 14Stocks dented by inflation risk from rising oil, dicey geopolitics | Reutersreuters.com
4. Market Data
Contract Snapshot
This Kalshi market asks about the "Fear & Greed Index on Friday?", with separate options to predict "Greed," "Fear," or "Neutral." The exact numerical thresholds or conditions for the Fear & Greed Index that would trigger a "YES" or "NO" resolution for any of these categories are not specified in the provided content. Trading for the market begins on Friday, September 11, at 9:30 am EDT, and the maximum payout date is listed as September 18, 2026. No special settlement conditions are detailed.
Market Discussion
The Fear & Greed Index for September 11, 2026, is not verifiable as of September 8, 2026, as it is a retrospective sentiment gauge rather than a forecasted value [1]. As of September 8, 2026, the index was reported at 42, signaling a shift to "Fear" ahead of the September 11, 2026 CPI report and the September 15-16 FOMC meeting, with market sentiment heavily influenced by hawkish Federal Reserve expectations for a rate hike [2]. Rising bond yields are a key investor anxiety, despite equity volatility (VIX Index) falling to near 1-year lows by the week of August 31, 2026 [3].
5. What key economic data releases or Federal Reserve communications in early September 2026 could act as catalysts to shift the Fear & Greed Index before September 11?
| Probability of Greed reading (Sep 11) | 29-34% [1][2][3][4] |
|---|---|
| August ISM Manufacturing PMI | 54.60 [1][5][6][7][8][9][10] |
| August Employment Situation release | September 4 [11] |
Sources (13)
- 1Strong US jobs data likely to tip the balance for the Fed | UBS Globalubs.com
- 2Fear & Greed Index on Friday? Odds & Predictions 2026 - Kalshikalshi.com
- 3Fear & Greed Index on Sep 11, 2026? — Kalshi Prediction Market Odds | CoinRithmcoinrithm.com
- 4Stock Market News From Sept. 1, 2026: Dow, S&P 500, Nasdaq...barrons.com
- 5seekingalpha.comOctagon Agent
- 6seekingalpha.comOctagon Agent
- 7seekingalpha.comOctagon Agent
- 8www.youtube.comOctagon Agentyoutube.com
- 9seekingalpha.comOctagon Agent
- 10seekingalpha.comOctagon Agent
- 11Schedule of Selected Releases 2026 - Bureau of Labor Statisticsbls.gov
- 12Schedule of Selected Releases for September 2026bls.gov
- 13Schedule of Selected Releases for September 2026data.bls.gov
6. Which of the seven components of the CNN Fear & Greed Index are currently signaling 'Greed', and how do they weigh against the components still indicating 'Fear'?
| Index components | Stock price momentum, Stock price strength, Stock price breadth, Put and call options, Junk bond demand, Market volatility, Safe-haven demand [1][2] |
|---|---|
| Sep 11, 2026 component readings | Not available [3][4][5][6][7][8] |
| Implied probability of 'Greed' on Sep 11, 2026 | Approximately 28.9% (as of September 8, 2026) [9] |
Sources (10)
- 1CNN's Fear & Greed Index — What it Means for Global...investingnews.com
- 2The Stock Market's Fear & Greed Index Just Shifted Toward Greed...finance.yahoo.com
- 3seekingalpha.comOctagon Agent
- 4seekingalpha.comOctagon Agent
- 5seekingalpha.comOctagon Agent
- 6www.youtube.comOctagon Agentyoutube.com
- 7seekingalpha.comOctagon Agent
- 8seekingalpha.comOctagon Agent
- 9Fear & Greed Index on Sep 11, 2026? — Kalshi Prediction Market Odds | CoinRithmcoinrithm.com
- 10Fear and Greed Index: Historical Data & Chart (2011–2026)finhacker.cz
7. How does the sentiment reading from the CNN Fear & Greed Index compare to other key indicators like the VIX and the AAII Investor Sentiment Survey in early September 2026?
| CNN Fear & Greed Index (Aug 14, 2026) | 65 (Greed) [1] |
|---|---|
| VIX (Sep 3, 2026) | 14.32 [2] |
| AAII Bullish Sentiment (week ending Sep 2, 2026) | 39.70% [3][4][5][6][7][8] |
Sources (9)
- 1Fear and Greed Index: Historical Data & Chart (2011–2026)finhacker.cz
- 2CBOE Volatility Index: VIX (VIXCLS) | FRED | St. Louis Fedfred.stlouisfed.org
- 3seekingalpha.comOctagon Agent
- 4seekingalpha.comOctagon Agent
- 5seekingalpha.comOctagon Agent
- 6www.youtube.comOctagon Agentyoutube.com
- 7seekingalpha.comOctagon Agent
- 8seekingalpha.comOctagon Agent
- 9Fear & Greed Index on Sep 11, 2026? — Kalshi Prediction Market Odds | CoinRithmcoinrithm.com
8. Based on historical data, what is the typical behavior of the Fear & Greed Index in September, especially following periods of low summer volatility?
| Extreme Fear Index (September 2008) | 12 [1][2] |
|---|---|
| Extreme Greed Index (September 2012) | above 90 [1][2] |
| Volatility Factor in Alternative.me's Index | 25% [3][4][5][6][7][8][9][10] |
Sources (12)
- 1How CNN's Fear & Greed Index Impacts Investor Sentimentinvestopedia.com
- 2CNN's Fear & Greed Index — What it Means for Global Markets | INNinvestingnews.com
- 3Fear & Greed Index on Friday? Odds & Predictions 2026 - Kalshikalshi.com
- 4Fear & Greed Index on Sep 11, 2026? — Kalshi Prediction Market Odds | CoinRithmcoinrithm.com
- 5seekingalpha.comOctagon Agent
- 6seekingalpha.comOctagon Agent
- 7seekingalpha.comOctagon Agent
- 8www.youtube.comOctagon Agentyoutube.com
- 9seekingalpha.comOctagon Agent
- 10seekingalpha.comOctagon Agent
- 11Fear and Greed Index - Investor Sentiment - CNNcnn.com
- 12Fear & Greed Index: How to Read It and Use It in Trading - Axioryaxiory.com
9. What specific macroeconomic thresholds, such as a core CPI reading or unemployment rate, would likely trigger a decisive move into 'Extreme Fear' or 'Extreme Greed'?
| Direct Macro Inputs to Fear & Greed Index | Macroeconomic data like core CPI or unemployment are not direct, hard-coded inputs [1][2][3] |
|---|---|
| Direct Macro Thresholds for Extreme Index Levels | No specified direct macroeconomic thresholds for 'Extreme Fear' (0-24) or 'Extreme Greed' (75-100) based on core CPI or unemployment rates [4][3][5][1][2] |
| Macro Influence on Fear & Greed Index | Influences indirectly through its seven equally-weighted components [1][2][3] |
Sources (8)
- 1Fear and Greed Index - Investor Sentiment - CNNcnn.com
- 2How CNN's Fear & Greed Index Impacts Investor Sentimentinvestopedia.com
- 3Fear & Greed Index - fffinstillfffinstill.com
- 4Fear and Greed index: Definition and how it works - Glossary - BUXbux.com
- 5What Is the Crypto Fear and Greed Index? - Changellychangelly.com
- 6https://www.cmegroup.com/education/files/managed-futures-and-volatility.pdfcmegroup.com
- 7How Do Monetary Policy Surprises Affect Household Sentiment?clevelandfed.org
- 8How Do Monetary Policy Surprises Affect Household Sentiment?clevelandfed.org
10. What Could Change the Odds
Key Catalysts
Key Dates & Catalysts
- Expiration: September 18, 2026
- Closes: September 18, 2026
Sources (9)
- 1Weekly Market Outlook | 7–11 September - OnEquityinsights.onequity.com
- 2Market outlook for the week of 7th-11th Septemberinvestinglive.com
- 3Market Outlook This Week: US CPI in Focus as WTI Oil Surges on Iran Tensionstraderfactor.com
- 4Week Ahead: Strong US Jobs Data Puts Fed Hike Back in Focus as CPI Takes Centre Stage - VT Marketsvtmarkets.com
- 5BCR - Transparent and Reliable CFDs Trading Platformcfds.thebcr.com
- 6Will the Federal Reserve Hike rates by 0bps at their September 2026 meeting? | Paritypredictparity.com
- 7Fed Rate Decision September 2026 Odds | Polymarket & Kalshipredictmarketcap.com
- 8Markets Head Lower as Iran Conflicts Intensify | Cboecboe.com
- 9S&P Global Investment Manager Index™ (IMI™)pmi.spglobal.com
12. Historical Resolutions
Historical Resolutions: 20 markets in this series
Outcomes: 4 resolved YES, 16 resolved NO
Recent resolutions:
- KXFEAR-26SEP04-XGREE: NO (Sep 05, 2026)
- KXFEAR-26SEP04-XFEAR: NO (Sep 05, 2026)
- KXFEAR-26SEP04-NEUT: NO (Sep 05, 2026)
- KXFEAR-26SEP04-GREE: NO (Sep 05, 2026)
- KXFEAR-26SEP04-FEAR: YES (Sep 05, 2026)
