Short Answer

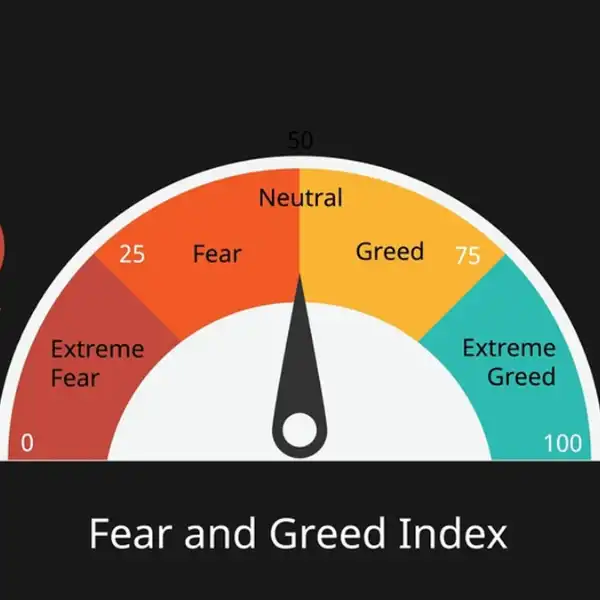
The market does not expect the Fear & Greed Index to show "Greed" on September 18, 2026, pricing this outcome at 27.0%.

1. Market Behavior & Drivers

The market's largest move, a 20 percentage point spike in the "Fear" contract on August 24, 2026, lacks a clear reported catalyst. The price jump occurred on the same day the underlying Crypto Fear & Greed Index moved sharply in the opposite direction to 73, a reading of "Extreme Greed".
Subsequent price action was tied to identifiable macroeconomic and policy developments. On August 25, the "Neutral" contract rose 9 percentage points following a US Treasury decision to double its long-end debt buybacks to $4 billion per operation. This was followed on September 2 by a 9 point drop in the "Greed" contract, which coincided with the CNN Business Fear & Greed Index falling to 31.3 and entering its "Fear" zone based on economic data releases.
  • Extreme Greed holds the highest market probability after a significant spike.
  • Fear sentiment is high following a recent sharp drop in the index.
  • Upcoming FOMC meeting and rate hike probability drive market uncertainty.

Current Context

Prediction markets currently forecast the Fear & Greed Index on September 18, 2026. Kalshi and Coinbase are hosting events for the index reading at 4:00 PM ET on this date [1][2]. September 18, 2026, falls on a Friday in ISO week 38 [3][4]. While the Crypto Fear & Greed Index is a recognized sentiment tool, specific expert-curated forecasts for its reading on September 18, 2026, are not publicly available [5].
Financial markets are currently driven by monetary policy uncertainty as of early September 2026. The Federal Open Market Committee (FOMC) is scheduled to meet on September 15-16, 2026, to discuss potential interest rate hikes amidst elevated inflation [6][7]. Experts monitor the September 16 Fed meeting, with expectations for rate adjustments shifting based on incoming CPI, PPI, and labor market data [8][9][10][11][12].
Overall macroeconomic sentiment remains cautiously constructive despite ongoing concerns. Elevated interest rates, persistent inflation, and concentrated equity valuations concern market participants [8][9][10][11][12]. Cboe reports from late August 2026 indicate broader equity volatility reached near-1-year lows, even with volatility spikes from geopolitical tensions like the U.S.-Iran conflict [7][13]. This indicates complex sentiment, balancing optimism in equity fundamentals with anxiety over inflation and interest rates [7][13].
Sources (13)
  1. 1Fear & Greed Index on Sep 18, 2026? - Kalshikalshi.com
  2. 2Fear & Greed Index on Sep 18, 2026? | Prediction Markets | Coinbasecoinbase.com
  3. 3September 18 - Wikipediaen.wikipedia.org
  4. 4September 18, 2026: What Week Number? | Week 38week-numbers.com
  5. 5Uncertain Regulations, Definite Impacts: The Impact of the U.S. Securities and Exchange Commission's Regulatory Interventions on Crypto Assetssec.gov
  6. 6Speech by Governor Waller on the economic outlook - Federal Reserve Boardfederalreserve.gov
  7. 7Markets Head Lower as Iran Conflicts Intensify | Cboecboe.com
  8. 8September 2026 Market Outlook | MRA Advisory Groupmraadvisory.com
  9. 9September Stock Market Outlook: How to Position Your Portfolio...morningstar.com
  10. 10Week ahead – Dollar at a crossroads as CPI and ECB take centre stagefxstreet.com
  11. 11Video: September 2026 Economic and Market Outlookceritypartners.com
  12. 12LMAX Group Opinions - Views and Insights on the FX Industrylmax.com
  13. 13Week of 8/31/2026: Equity Volatility Falls to Near a 1-Year Low Post Jackson Hole | Cboecboe.com

2. Price Chart

Historical Price (Probability)

Outcome probability
Date

3. Significant Price Movements

Notable price changes detected in the chart, along with research into what caused each movement.

Outcome: Fear

📉 September 04, 2026: 45.0pp drop

Price decreased from 77.0% to 32.0%

What happened: The provided research indicates there is no verified evidence of a 45.0 percentage point drop in the Fear & Greed Index or any major financial volatility indicator on September 4, 2026 [1][2][3][4][5][6][7][8][9][10]. Reports of such a significant decline appear to be unfounded or misattributed, with references to "45.0pp" typically applying to other market probability contracts or stock performance [11][12]. As such, it is not possible to identify a primary driver for a price movement that lacks verified occurrence. Therefore, social media was irrelevant as a driver for this unsubstantiated event.

📈 August 24, 2026: 20.0pp spike

Price increased from 1.0% to 21.0%

What happened: The provided research does not identify a specific social media catalyst or primary driver for a 20.0 percentage point spike in the prediction market price for the "Fear" outcome on August 24, 2026 [13]. Instead, on August 24, 2026, the Crypto Fear & Greed Index actually jumped to 73, signifying a shift towards "Greed," largely due to a Bitcoin rally catalyzed by a U.S. Treasury announcement to double bond buybacks [14]. This market movement would typically lead to a decrease, not a spike, in the prediction market price for a "Fear" outcome. Therefore, social media was not identified as a primary driver for the stated market movement, and the evidence does not support the premise of a spike for "Fear" on this date.

Outcome: Extreme Greed

📈 September 03, 2026: 62.0pp spike

Price increased from 10.0% to 72.0%

What happened: The provided research does not support a "62.0 percentage point spike" in the Fear & Greed Index to "Extreme Greed" on September 3, 2026 [16-21]. Historical data shows the Crypto Fear & Greed Index at 65 ("Greed") on September 3, 2026, not "Extreme Greed," and no such spike is recorded [15]. Furthermore, there is no publicly available data or credible report of a 62.0pp spike in a financial index on that date, nor any associated social media catalysts [16]. Therefore, identifying a primary driver, including social media activity, for a movement that is not evidenced is not possible. Social media was irrelevant, as the described event lacks factual basis in the provided data.

Outcome: Greed

📉 September 02, 2026: 9.0pp drop

Price decreased from 36.0% to 27.0%

What happened: The primary driver for the 9.0 percentage point drop in the "Greed" outcome for the "Fear & Greed Index on Sep 18, 2026?" prediction market was traditional news and economic data releases on September 2, 2026. The CNN Business Fear & Greed Index plummeted to 31.3, entering the "Fear" zone due to renewed U.S.-Iran geopolitical tensions, rising U.S. Treasury yields, and weak private payroll data [17][18]. This sharp decline in the actual index coincided with and directly influenced the prediction market's reduced probability for a "Greed" outcome in mid-September. Social media was not identified as a primary driver, and no specific influential posts were evident in the provided research.

Outcome: Neutral

📈 August 25, 2026: 9.0pp spike

Price increased from 13.0% to 22.0%

What happened: The primary driver for the "Neutral" outcome's 9.0 percentage point price spike on August 25, 2026, was a US Treasury policy decision to double long-end debt buybacks to $4 billion per operation [19]. This policy, combined with a major short squeeze in the crypto markets, catalyzed a significant sentiment shift from pessimism towards 'Greed' or 'Extreme Greed' around that date, notably causing the Crypto Fear & Greed Index to spike [20][21][22][19]. This broad market sentiment improvement likely increased the perceived probability of the general Fear & Greed Index being "Neutral" by September 18, 2026. Social media activity was not identified as a primary driver or contributing accelerant in the provided information.
Sources (22)
  1. 1Week of 8/31/2026: Equity Volatility Falls to Near a 1-Year Low Post Jackson Hole | Cboecboe.com
  2. 2Speech by Governor Waller on the economic outlook - Federal Reserve Boardfederalreserve.gov
  3. 3Cross-Asset Volatilities Rise on Rate Policy Uncertainty | Cboecboe.com
  4. 4How Stocks and the VIX Index Can Rise Together | Cboecboe.com
  5. 5VIX Volatility Products - Cboe Global Marketscboe.com
  6. 6Markets Head Lower as Iran Conflicts Intensify | Cboecboe.com
  7. 7Week of 8/3/2026: The Fed Holds, But Bond Volatility Breaks Higher | Cboecboe.com
  8. 8S&P Global Investment Manager Index™ (IMI™)pmi.spglobal.com
  9. 9Index Insights: August 2026 | Cboecboe.com
  10. 10S&P Global Investment Manager Index™ (IMI™)pmi.spglobal.com
  11. 11Odds of a Trump announcement lifting the Hormuz blockade fall; USglobal-political-spotlight.com
  12. 128 Red Days In A Row: Unity Software Stock Is Down 13% | Trefistrefis.com
  13. 13www.foxbusiness.comOctagon Agentfoxbusiness.com
  14. 14Crypto Fear \& Greed Index Hits Second-Highest Single-Day Level in a Year - BlockBeatsen.theblockbeats.news
  15. 15Crypto Fear & Greed Index: 69 (Aug 30, 2026) | Convexconvextrade.com
  16. 16Fear and Greed Index: Historical Data & Chart (2011–2026)finhacker.cz
  17. 17U.S. Stock Market Fear Index Plummets to 31.3, Concerns Over September Effect | WEEX Crypto Newsstg-www.weex.tech
  18. 18Dow Jumps Around 300 Points Ahead Of Jobs Report: Investor Sentiment Improves, But Fear & Greed Index Rem - Benzingabenzinga.com
  19. 19Crypto Fear and Greed Index Hits 74, Highest Since October 2025 — Latest News | MetaTradermetatrader.com
  20. 20Crypto Market Flips From Fear to 'Extreme Greed' for First Time Since 2024 - Decryptdecrypt.co
  21. 21Crypto fear and greed index hits 81, shifts to extreme greed after 616 days - CoinNesscoinness.com
  22. 22Crypto Fear & Greed Index Reaches 74, Highest Since Octobercoinedition.com

4. Market Data

Contract Snapshot

This Kalshi market asks about the state of the Fear & Greed Index on September 18, 2026. A "Yes" resolution for a specific market (e.g., "Fear", "Greed", or "Neutral") occurs if the Fear & Greed Index is categorized as that state on September 18, 2026, at 9:30 AM EDT; otherwise, it resolves to "No". The maximum payout date for contracts is September 25, 2026, and no special settlement conditions are detailed in the provided content.

Market Discussion

As of September 4, 2026, there is no verifiable, realized Fear & Greed Index reading available for September 18, 2026, as that date is in the future [1]. However, prediction markets on platforms like Kalshi are actively trading contracts for this date, reflecting varied outcomes and showing market-implied probabilities for classification as 30% Fear, 30% Greed, and 26% Neutral [2][3][1]. The current market environment is marked by high uncertainty regarding monetary policy, with a hawkish shift in interest rate expectations influenced by the upcoming FOMC meeting scheduled for September 15-16, 2026 [4][5][6].

Sources (6)
  1. 1www.cnbc.comOctagon Agentcnbc.com
  2. 2Fear & Greed Index on Sep 18, 2026? - Kalshikalshi.com
  3. 3Fear & Greed Index on Sep 18, 2026? | Prediction Markets | Coinbasecoinbase.com
  4. 4Speech by Governor Waller on the economic outlook - Federal Reserve Boardfederalreserve.gov
  5. 5Week of 8/31/2026: Equity Volatility Falls to Near a 1-Year Low Post Jackson Hole | Cboecboe.com
  6. 6Week of 8/17/2026: Volatility/Convexity Premia Fall to Lowest YTD Levels on Benign Inflation Data | Cboecboe.com

5. What historical precedent exists for geopolitical shocks, like the U.S.-Iran conflict, pushing the Fear & Greed Index into 'Extreme Fear' territory?

Extreme Fear CatalystsGeopolitical shocks, including military conflicts (e.g., U.S.-Iran), triggering broad risk-off movements and uncertainty [1][2][3][4][5]
Historical Extreme Fear EventsTariff threats against China (October 2025), onset of COVID-19 pandemic (March 2020) [2]
Recent Escalation PeriodMultiple U.S.-Iran / Iran-Gulf episodes (last 6 months up to early September 2026) causing market shifts [6][7][8][9][10][11]
Geopolitical shocks historically drive the Fear & Greed Index to 'Extreme Fear'. Geopolitical shocks, especially military conflicts such as those involving the U.S. and Iran, are significant factors in pushing the Fear & Greed Index into 'Extreme Fear' territory [1][2][3][4][5]. These events typically trigger widespread risk-off movements, heightened market uncertainty, and increased volatility across global markets. Historical precedents illustrating this pattern include tariff threats against China in October 2025 and the onset of the COVID-19 pandemic in March 2020, both of which resulted in 'Extreme Fear' readings [2].
Recent U.S.-Iran escalations have consistently pushed the index toward 'Extreme Fear'. Within the six months leading up to early September 2026, several U.S.-Iran and Iran-Gulf escalation episodes have occurred, consistent with driving the CNN Fear & Greed Index towards 'Extreme Fear' through its constituent components [3][6][7][8][9][10][11]. These incidents, such as the Iran crisis in early March 2026 disrupting the Strait of Hormuz and inducing a "Cash is king" risk-off scenario, typically manifest as lower market momentum, reduced market breadth, heightened volatility, and increased demand for safe-haven assets [3][6][7][8][9][10][11]. Specific events include Qatar suspending LNG operations and the Strait of Hormuz being described as near-halted on March 4, 2026, and Iran threatening broader retaliation on March 20, 2026, coupled with U.S. warship deployments, which together drove put demand and safe-haven rotations [1][2][6][7][8][9][10][11]. Later, on May 4, 2026, U.S. stocks and the S&P 500 experienced declines amid Middle East anxiety following reports of a U.S. warship near Hormuz, directly impacting market momentum and strength [4][6][7][8][9][10][11]. Renewed U.S.-Iran fire exchanges from August 31 to September 3, 2026, further contributed to higher oil prices and cautious stock markets, increasing volatility and put demand while decreasing appetite for junk bonds [12][13][14][6][7][8][9][10][11].
Specific Fear & Greed Index data for September 18, 2026, is not available. However, the research findings do not include specific Fear & Greed Index values or classifications for September 18, 2026, nor do they contain an explicit 'Extreme Fear' event log for the period immediately preceding that date [6][7][8][9][10][11].
Sources (14)
  1. 1Fear & Greed at 8: Inside the Triple Shock That Sent Crypto...blockeden.xyz
  2. 2CNN's Fear & Greed Index — What it Means for Global Markets | INNinvestingnews.com
  3. 3Fear and Greed Index - Explained - Economics Helpeconomicshelp.org
  4. 4Managing your money when geopolitical risk and volatility are highcnn.com
  5. 5Fear and Greed Index Explained: How to Use It - FinMastersfinmasters.com
  6. 6www.cnbc.comOctagon Agentcnbc.com
  7. 7www.foxbusiness.comOctagon Agentfoxbusiness.com
  8. 8www.cnbc.comOctagon Agentcnbc.com
  9. 9seekingalpha.comOctagon Agent
  10. 10seekingalpha.comOctagon Agent
  11. 11www.wsj.comOctagon Agentwsj.com
  12. 12Fear & Greed Index Hits 8-21 in Q1 2026 | Hashdex posted on the...linkedin.com
  13. 13Fear & Greed Index on Sep 18, 2026? - Kalshikalshi.com
  14. 14Kalshi Markets: Trump's Approval, EURUSD, Diesel Pricespredictionnewsnetwork.com

6. How are the seven underlying components of the CNN Fear & Greed Index trending throughout August and early September 2026?

Fear & Greed Index (Sept 3, 2026)42 (Neutral) [1]
Fear & Greed Index (previous week)51 [1]
Number of index components7 (equally weighted) [2][3][4]
Specific component trends for the Fear & Greed Index are unavailable for August 2026. The provided research does not include the dated time series for the seven underlying components of the CNN Fear & Greed Index for August 2026 and early September 2026 [5][6][7][8][9][10]. Consequently, it is not possible to detail how each individual component was trending throughout that period [5][6][7][8][9][10].
The CNN Fear & Greed Index uses seven equally weighted indicators. These indicators include stock price momentum, stock price strength, stock price breadth, put and call options, junk bond demand, market volatility, and safe-haven demand [2][3][4]. For example, market momentum exceeding its 125-day average or a greater number of NYSE 52-week highs than lows indicates 'greed' [5][6][7][8][9][10]. Conversely, a rising put/call ratio or an increase in the VIX relative to its 50-day average suggests 'fear' [5][6][7][8][9][10]. While the definitions of these components are confirmed, dated archive values for their individual movements during the specified period are not provided by the research [5][6][7][8][9][10].
The overall Fear & Greed Index trended towards 'Fear' in early September. Although specific component trends for August and early September 2026 are unavailable, the overall Fear & Greed Index registered 42 (Neutral) as of September 3, 2026 [1]. This marked a decline from 51 in the preceding week, indicating a movement toward the 'Fear' zone [1].
Sources (10)
  1. 1Stock Market Fear and Greed Index Today: 54 (Neutral) - CFGI.iocfgi.io
  2. 2Fear and Greed Index - Investor Sentiment - CNNcnn.com
  3. 3Fear and Greed Index: What It Is & How It Works | Seeking Alphaseekingalpha.com
  4. 4The Stock Market's Fear & Greed Index Just Shifted Toward Greed...finance.yahoo.com
  5. 5www.cnbc.comOctagon Agentcnbc.com
  6. 6www.foxbusiness.comOctagon Agentfoxbusiness.com
  7. 7www.cnbc.comOctagon Agentcnbc.com
  8. 8seekingalpha.comOctagon Agent
  9. 9seekingalpha.comOctagon Agent
  10. 10www.wsj.comOctagon Agentwsj.com

7. How did the CNN Fear & Greed Index compare to the Crypto Fear & Greed Index during previous periods of significant Fed policy uncertainty?

Direct Index Comparison FeasibilityNot possible due to missing index values for last 6 months [1][2][3][4][5][6]
Crypto-Nasdaq 100 Correlation+0.35 to +0.6 (as of 2025/2026) [7]
Key Fed Uncertainty Periods 2026March 17–18, April 29, June 16–17, July 28–29 FOMC meetings; July 10 Monetary Policy Report; early-to-mid August [1][2][3][4][5][6]
Direct comparison of market sentiment indices is hindered by data limitations. A direct comparison and quantification of correlation or lead-lag relationships between the CNN Fear & Greed Index and the Crypto Fear & Greed Index during prior Fed-policy-uncertainty periods is not possible. This is due to the unavailability of specific index values for the requested last-6-month window [1][2][3][4][5][6], which prevents a granular analysis of how these indices moved in response to monetary policy developments.
Both indices gauge sentiment, but use distinct market-specific methodologies. Despite the lack of specific comparative data, both the CNN Fear & Greed Index and the Crypto Fear & Greed Index aim to measure market sentiment on a 0-100 scale, utilizing distinct methodologies tailored to their respective markets [8][9][10]. The CNN index focuses on stock-market indicators, while the Crypto index incorporates cryptocurrency-specific metrics [8][9][10]. Both indices can react sharply to Fed policy uncertainty, with the CNN index often reflecting concern over interest rates and inflation, and the Crypto index showing sensitivity to macroeconomic and monetary policy shifts that drive risk-off sentiment [10]. Notably, during periods of heightened economic uncertainty and Federal Reserve interest rate increases, cryptocurrencies like Bitcoin have exhibited a positive correlation with equity markets, especially the tech-heavy Nasdaq 100, acting similarly to other risk-on assets [11][7]. This positive correlation has been consistently observed, ranging from +0.35 to +0.6 as of 2025/2026, suggesting that both sectors respond to similar macroeconomic signals during periods of policy uncertainty [7].
Several 2026 periods showed elevated Fed policy uncertainty and concerns. Identified periods of elevated Federal Reserve policy uncertainty in 2026 include the FOMC meetings on March 17–18, April 29, June 16–17, and July 28–29, as well as the Monetary Policy Report to Congress on July 10, and early-to-mid August following the release of July minutes [1][2][3][4][5][6]. These times were marked by concerns regarding the economic outlook, geopolitical developments, government policy, AI adoption, two-sided risks, and internal policy disagreements within the Fed [1][2][3][4][5][6]. Although monetary policy uncertainty remained a factor in the broader Economic Policy Uncertainty Index as of May 2026, the specific Fear & Greed Index levels for these periods are not available for direct analysis [1][2][3][4][5][6][12].
Sources (12)
  1. 1www.cnbc.comOctagon Agentcnbc.com
  2. 2www.foxbusiness.comOctagon Agentfoxbusiness.com
  3. 3www.cnbc.comOctagon Agentcnbc.com
  4. 4seekingalpha.comOctagon Agent
  5. 5seekingalpha.comOctagon Agent
  6. 6www.wsj.comOctagon Agentwsj.com
  7. 7Can Crypto World Break Free From Bitcoin’s Undertow? - CME Groupcmegroup.com
  8. 8Guide to the Fear and Greed Index | SoFisofi.com
  9. 9How CNN's Fear & Greed Index Impacts Investor Sentimentinvestopedia.com
  10. 10CNN's Fear & Greed Index — What it Means for Global Markets | INNinvestingnews.com
  11. 11Why is Bitcoin Moving in Tandem with Equities? - CME Groupcmegroup.com
  12. 12May 2026, Monthly Indices: Categorical Economic Policy Uncertainty Indices | FRED | St. Louis Fedfred.stlouisfed.org

8. What historical data is available for the Fear & Greed Index in September of past pre-election years, and does it reveal any seasonal patterns?

Fear & Greed Index Launch2011 [1][2]
September Market TrendHistorically weakest month [3][4][5]
2026 Election TypeU.S. midterm election year [4]
The Fear & Greed Index offers limited historical data. Launched in 2011, the index restricts direct historical sentiment data to the period after its inception [1][2]. September is historically recognized as one of the weakest months for stock market performance, often referred to as the September Effect or Red September, and frequently manifests as heightened anxiety in market sentiment indicators [3][4][5].
Election years typically bring heightened market uncertainty. Sentiment during pre-election and election years is characterized by elevated uncertainty [1]. For instance, the Fear & Greed Index showed declines into "fear" territory in late 2016 and late 2020 due to election-related uncertainty, preceding eventual rebounds [1]. The year 2026 is a U.S. midterm election year, and historical data indicates that during midterm cycles, markets often experience significant drawdowns early in September, followed by stabilization and a rebound [4].
Sources (5)
  1. 1Guide to the Fear and Greed Index | SoFisofi.com
  2. 2How CNN's Fear & Greed Index Impacts Investor Sentimentinvestopedia.com
  3. 3Welcome to September, historically the worst month for stocks - CNNcnn.com
  4. 4Bitcoin's 'Red September' Curse: Historical Data and Market Patternskucoin.com
  5. 5The S&P 500 is within 2% of its all-time high, but the VIX, Treasury...facebook.com

9. What specific inflation and labor market data in early September 2026 could influence the Federal Reserve's rate decision at the September 15-16 FOMC meeting?

August Nonfarm Payrolls162,000 [1][2][3][4][5][6]
August Unemployment Rate4.1% [1][2][3][4][5][6]
July Headline PCE YoY+3.7% [1][2][3][4][5][6]
Early September economic data influences the Federal Reserve's rate decision. The Federal Reserve's Federal Open Market Committee (FOMC) is scheduled to meet on September 15-16, 2026, with an interest rate decision anticipated on September 16 [7][8][9]. Key economic reports available for consideration include a firm August Employment Situation report and persistent July Personal Consumption Expenditures (PCE) inflation. The August Consumer Price Index (CPI) and Producer Price Index (PPI) figures are expected to be released prior to the meeting but were not available at the time of the provided evidence [1][2][3][4][5][6].
Labor market data indicates a stable, though tight, environment. The August 2026 Employment Situation report, released on September 4, revealed nonfarm payrolls increased by 162,000, and the unemployment rate stood at 4.1%, surpassing forecasts [1][2][3][4][5][6]. Weekly jobless claims were reported at 206,000, indicating a cool but historically low level that further suggests a stable labor market [1][2][3][4][5][6][10]. The July 2026 Job Openings and Labor Turnover Survey (JOLTS) report, released September 1, showed an openings rate of 4.4%, reflecting robust yet slightly cooler labor demand [1][2][3][4][5][6].
Inflation remains a concern, with some sticky data points. The most recent comprehensive data on inflation, the July 2026 Personal Consumption Expenditures (PCE) report released August 26, showed headline PCE at +3.7% year-over-year and core PCE at +3.3% year-over-year, indicating slightly elevated or sticky inflation [1][2][3][4][5][6]. Additionally, the ISM Services survey's measure of prices paid by businesses for inputs experienced a significant increase in August [10]. Diesel prices also reached a record high of $5.85 per gallon on September 4, adding to potential inflationary pressures [1][2][3][4][5][6]. Upcoming key inflation data includes the August 2026 PPI, scheduled for September 10, and the August 2026 CPI, scheduled for September 11; neither report was available at the time of the provided evidence [1][2][3][4][5][6][11][12][13].
Sources (13)
  1. 1www.cnbc.comOctagon Agentcnbc.com
  2. 2www.foxbusiness.comOctagon Agentfoxbusiness.com
  3. 3www.cnbc.comOctagon Agentcnbc.com
  4. 4seekingalpha.comOctagon Agent
  5. 5seekingalpha.comOctagon Agent
  6. 6www.wsj.comOctagon Agentwsj.com
  7. 7Calendar: September 2026 - Federal Reserve Boardfederalreserve.gov
  8. 8The Fed - Meeting calendars and information - Federal Reservefederalreserve.gov
  9. 92026 FOMC Meeting Schedule: Sep 15–16 & All Dates | FedRateCalcfedratecalc.com
  10. 10US labor market remains stable; services input price rises... - Reutersreuters.com
  11. 11Schedule of Selected Releases 2026 - Bureau of Labor Statisticsbls.gov
  12. 12Schedule of Selected Releases for September 2026data.bls.gov
  13. 13Schedule of Selected Releases for September 2026bls.gov

10. What Could Change the Odds

Key Catalysts

The primary market catalyst for September 2026 is the Federal Reserve's FOMC meeting scheduled for September 16, 2026 [1]. Market data indicates a significant probability of a rate hike in response to inflation concerns and geopolitical tensions [1][2]. Inflation data, specifically CPI and PPI following the August payroll report, are the primary deciding variables for interest rate expectations [3]. As of early September 2026, CME FedWatch data indicated a 64% likelihood that the Federal Reserve would hike interest rates to a range of 3.75% to 4.0% at its September 16, 2026 meeting [2].
Prediction markets exist for the Fear & Greed Index reading on September 18, 2026, with current sentiment-based trading indicating an expectation of extreme fear [4][5]. However, financial experts and data analysis indicate the Fear & Greed Index functions as a diagnostic tool for current sentiment, not a reliable predictive indicator for future dates; its next-day correlation is historically near a coin flip (approximately 49%) [6][7][8][9]. There is no reliable method or expert-curated source to predict a specific future value for the Fear & Greed Index [10][11][12]. Separately, available market data for ^VIX and ^MOVE, covering March 4, 2026 to September 3, 2026, showed both indices lower near early September than in early March, suggesting a calmer volatility regime over that span [13][14][15][16][17][18].

Key Dates & Catalysts

  • Expiration: September 25, 2026
  • Closes: September 25, 2026
Sources (18)
  1. 1Speech by Governor Waller on the economic outlook - Federal Reserve Boardfederalreserve.gov
  2. 2Markets Head Lower as Iran Conflicts Intensify | Cboecboe.com
  3. 3Markets Weigh Jobs, But Inflation Data Holds the Key - Fed Odds Split as Yields Risetradevae.com
  4. 4Fear & Greed Index on Sep 18, 2026? - Kalshikalshi.com
  5. 5Fear & Greed Index on Sep 18, 2026? | Prediction Markets | Coinbasecoinbase.com
  6. 6How Accurate Is the Fear and Greed Index? The Data | CFGI Learncfgi.io
  7. 7How Accurate is the Fear and Greed Index? | CFGI Learncfgi.io
  8. 8Can the Fear and Greed Index Predict a Crash? | CFGI Learncfgi.io
  9. 9Is the Crypto Fear and Greed Index Accurate? | CFGI Learncfgi.io
  10. 10FRB: FEDS Notes: Forecasting Stock Market Crashes is Hard--Especially Future Ones: Can Option Prices Help?federalreserve.gov
  11. 11Reading VIXspglobal.com
  12. 12A Practitioner's Guide to Reading VIXcdn.cboe.com
  13. 13www.cnbc.comOctagon Agentcnbc.com
  14. 14www.foxbusiness.comOctagon Agentfoxbusiness.com
  15. 15www.cnbc.comOctagon Agentcnbc.com
  16. 16seekingalpha.comOctagon Agent
  17. 17seekingalpha.comOctagon Agent
  18. 18www.wsj.comOctagon Agentwsj.com

12. Historical Resolutions

Historical Resolutions: 20 markets in this series

Outcomes: 4 resolved YES, 16 resolved NO

Recent resolutions:

  • KXFEAR-26AUG28-XGREE: NO (Aug 28, 2026)
  • KXFEAR-26AUG28-XFEAR: NO (Aug 28, 2026)
  • KXFEAR-26AUG28-NEUT: YES (Aug 28, 2026)
  • KXFEAR-26AUG28-GREE: NO (Aug 28, 2026)
  • KXFEAR-26AUG28-FEAR: NO (Aug 28, 2026)